|
Santa Rosa County |
 |
Code of Ordinances |
|
Appendix D. 2040 COMPREHENSIVE PLAN |
|
Appendix 1.0. Future Land Use Element Supporting Documentation |
§ 1.3. Existing Land Use Analysis
The existing patterns and trends of development in Santa Rosa County have been used as a basis for determining future development potential and are evaluated in this section. The pattern and mix of existing land uses is indicative of the market forces, infrastructure constraints, and natural resource constraints which have shaped existing development and are likely to influence future growth. In addition, existing levels of development have been used to evaluate the adequacy of public facilities and services to serve this development and to identify potential constraints.
1.3.1 Existing Land Use in Unincorporated Santa Rosa County
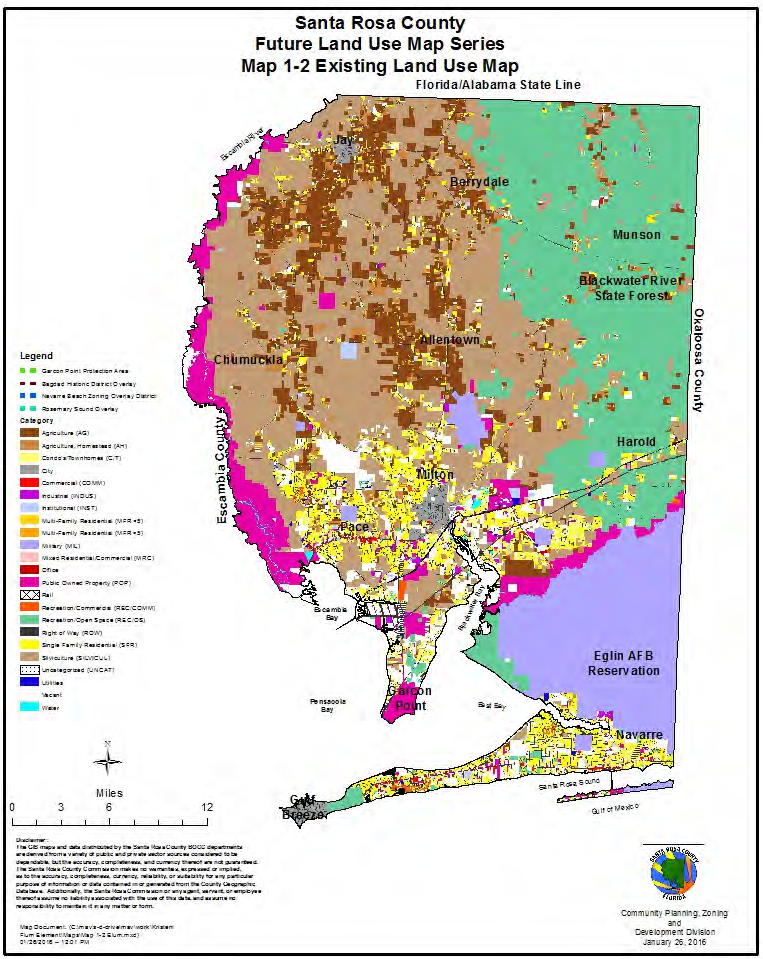
A generalized Existing Land Use Map has been developed by the Santa Rosa County Community Planning, Zoning and Development Division as representative of the existing pattern of development in unincorporated Santa Rosa County (see Map 1-3 ). The existing land use data for unincorporated Santa Rosa County is summarized in Tables 1-3 and 1-4.
As indicated in Table 1-3 , the highest percentage of land use in unincorporated Santa Rosa County is agriculture/silviculture. This land use, consisting of productive farm, grazing land and timberland takes up over 39% of the land area in the unincorporated portion of the county. The second-largest percentage of land use (23%) is conservation, recreation and open space land (primarily the Blackwater River State Forest). The next highest percent of land use is residential (7%), ranging from very low-density agricultural homestead to high-density multi-family units, with the majority in the form of low-density, single-family detached residential units. Eleven percent (11%) of the unincorporated county area is owned by the military—Eglin Air Force Base, Whiting Field and its outlying fields (NOLFs). Approximately 46,230 acres of land in unincorporated Santa Rosa County are designated vacant (7%).
Table 1-4 , provides existing land use by planning area. Figure 1-3 below depicts the existing residential commercial mix within the growth areas of the county. As can be seen the ratio of residential development to commercial development is relatively the same for the Pace and South End Peninsula areas (around 10 to 1) with close ratios for the Milton and East Milton Planning Areas (around 8 to 1).
Figure 1-3: Existing Residential and Commercial Land Uses for Select Growth Planning Areas (2015)
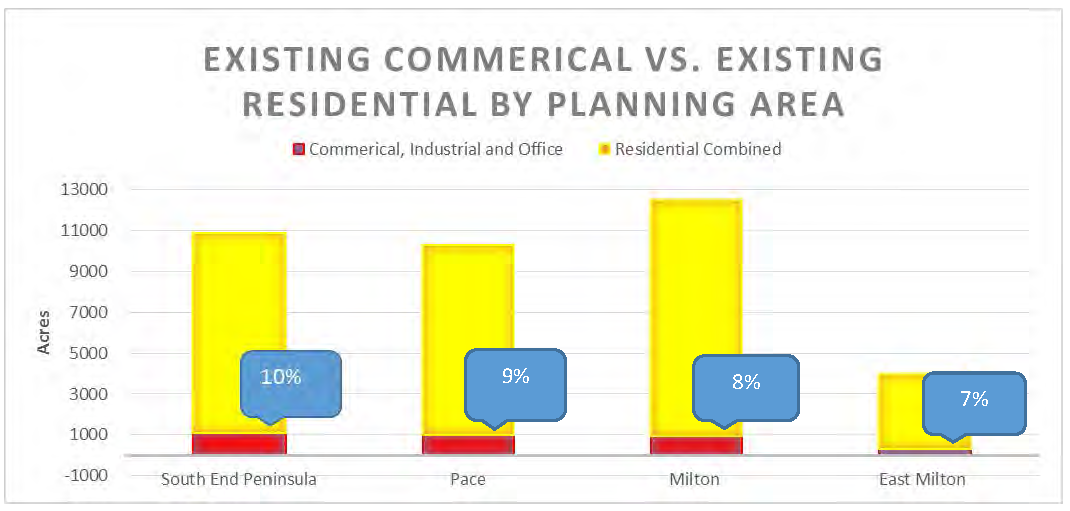
Table 1-3: Existing Land Use Change 2008-2013 in Unincorporated Santa Rosa County
Land Use Category 2008
Acreage2008
Percentage2013
Acreage2013
Percentage% Change
2008—2013Agriculture 77,872.74 12% 63,957.30 10% -18% Silviculture 180,820.92 28% 191,401.68 29% +6% Agriculture Homestead 14,506.34 2% 16,329.56 3% +13% Conservation, Recreation and Open Space 135,771.05 21% 148,347.01 23% +9% Military 72,864.05 11% 73,024.99 11% +0.22% Institutional 3,028.10 0.47% 2,704.43 0.42% -11% Publicly-Owned Land 46,768.90 7% 40,727.74 6% -13% Vacant 50,625.15 8% 46,230.63 7% -9% Residential 44,245.53 7% 44,092.02 7% -0.35% Single Family Residential 43,759.16 7% 43,570.45 7% -0.43% Condo/Townhouse 59.67 0.01% 68.73 0.01% +15% Multi-Family 426.7 0.07% 452.84 0.07% +6% Mixed Residential/Commer-
cial509.92 0.08% 379.50 0.06% -26% Office 325.89 0.05% 375.40 0.06% +15% Commercial 2,543.73 0.39% 2,822.92 0.43% +11% Recreational Commercial (New) 1,394.21 0.21% Industrial 2,965.30 0.46% 2,004.07 0.31% -32% Utilities 612.66 0.09% 1,041.24 0.16% +70% Right-of-Way 14,140.13 2.18% 14,777.79 2% +5% Water 928.88 0.14% 1,109.31 0.17% +19% Miscellaneous (no property appraiser code, wasteland, etc.) 150.09 0.02% 95.40 0.01% -36% Total 648,679.16* 100 % 649,420.99 100% * Note: The total acreage for Santa Rosa County listed here was calculated based on the County GIS database for Property Appraiser Department of Revenue (DOR) land use code boundaries. This figure does not precisely match acreage figures used in the 2000 Census Information and in other databases from various agencies utilized for information in other elements of this Comprehensive Plan Foundation Document. Change in total County acres 2008—2013 is due to shoreline adjustments.
Source: Santa Rosa County Community Planning, Zoning and Development Division GIS 2008 and 2013
Table 1-4 Existing Land Use Map Acreage by Planning Area
Land Use Category South End Garcon
PointPace Area Milton Area East Milton Rural
NorthPeninsula Navarre Beach Agriculture 99 400 2,517 4,326 505 56,111 Agriculture Homestead 97 169 1,086 1,39597 346 13,325 Condo's/Townhomes <5 95 4 36 59 4 Multifamily Residential >5 101 48 2 86 67 Commercial 580 6 26 400 196 97 123 Industrial 406 152 428 679 172 167 Institutional 624 41 478 463 18 1,081 Military 664 828 3,520 1,338 5 Mixed Residential/Commer-
cial63 0.32 124 126 40 25 Office 106 0.47 1 149 71 25 23 Publicly Owned 662 329 4,180 11,757 5,381 3,760 10,123 Recreation/Commercial 482 309 194 177 155 77 Recreation/Open Space 815 57 782 209 373 21,231 123,621 Right-of-Way 3,252 100 1,357 2,227 3,056 1,057 3,131 Single Family Residential 9,596 88 1,600 9,209 11,419 3,702 7,957 Silviculture 1,046.9 2,772 20,206 16,726 6,826 143,826 Utilities 346 32 250 287 94 32 Vacant 8,732 158 5,913 11,121 12,305 3,251 4,646 Uncategorized 38 .28 5 39 0.21 13 Source: Santa Rosa County Community Planning, Zoning and Development Division GIS, 2014
2.5.2 Suitability of Vacant Lands for Development
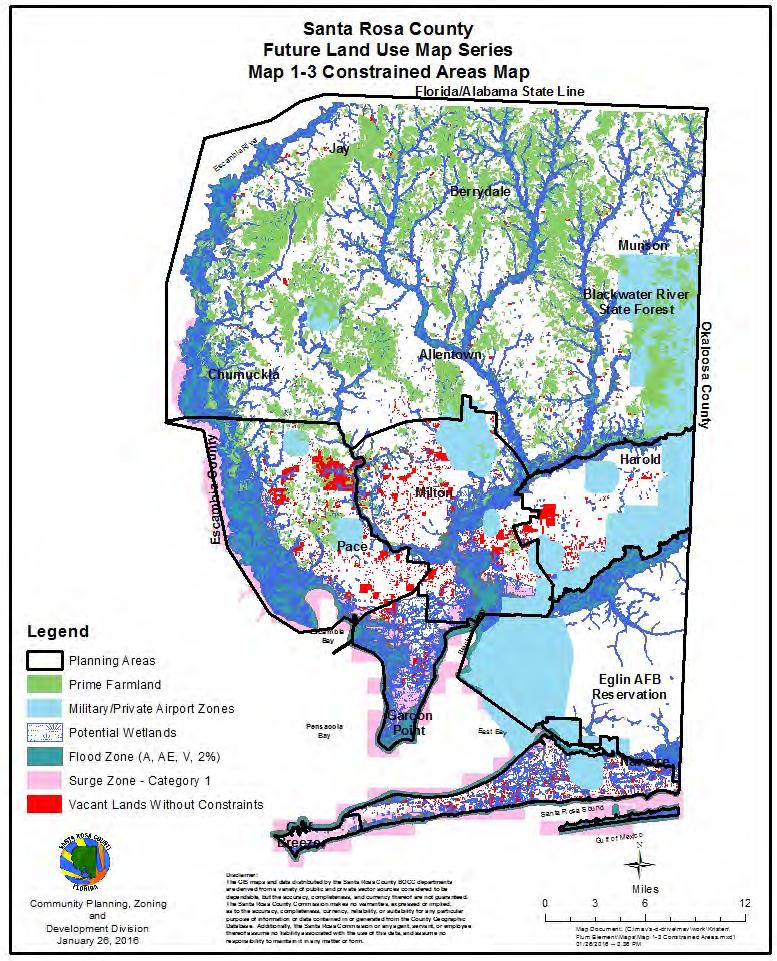
Vacant lands have been analyzed by planning area to determine the general suitability of these lands for development. In order to determine suitability of vacant lands the following constraints were selected and the table below provides an analysis of these constraints by planning area. Map 1-4 shows the general location of these constraints and the planning area boundaries. Table 1-5 indicates that approximately 20% of the vacant lands are constrained with one or more of the constraints listed below. Analysis is also provided in this table of the same constraints by Planning Area. Two of the main growth areas in the County, the South End Peninsula and the Pace area have 38% and 54% constrained lands respectively.
Other growth areas include the Milton Planning area with 59% constrained and the East Milton area with 64% constrained.
Selected Constraints:
Military Airport Zone/Private Airport Zone (limits allowable densities and intensities)
Prime Farmland (categorized by soils type)
Surge Zone for Category 1 Hurricane (Coastal High Hazard Line)
National Wetlands Inventory
Flood Plain Zones A, AE, V and 2% slope
Table 1-5: Suitability Analysis of Vacant Lands
Planning Area Vacant Acres Vacant No Constraints Percent Constrained East Milton 4,446 2,862 64% Garcon Point 5,928 775 13% Milton 17,317 10,236 59% Navarre Beach 158 2 1% North End 4,703 2,459 52% Pace 12,474 6,772 54% South End 8,702 3,348 38% Total: 53,728 10,120 19% Source: Santa Rosa County GIS, 2014